
Executive Summary
Revenue performance is highly concentrated in a few regions and product categories. Sub‑Saharan Africa and Europe together generate more than half of total revenue, while Cosmetics, Office Supplies, and Household goods drive ~70%. Offline channels dominate in scale, but online channels deliver stronger margin efficiency.
A targeted 10% increase in investment in Sub‑Saharan Africa (Offline), Europe (Online), and Australia & Oceania (Offline) is projected to deliver +USD 4.52M in revenue and +USD 1.52M in profit, representing a 3-4% uplift in total performance.
Business Problem
The objective of this diagnostic report is to evaluate global sales performance across 100 markets to identify high-performing segments capable of driving sustained revenue growth. By analyzing regional and product-level data, the study provides a strategic framework for resource allocation while specifically addressing geographic and category concentration risks to protect overall profit margins.
Data Overview
This analysis examines 100 country-level market aggregates representing a global revenue portfolio of USD 137.1M. The dataset reveals significant heterogeneity across markets:
- Market Volume Range: 124 – 9,925 units per market
- Pricing Range: USD 9.33 – 668.27 per unit
- Regional Coverage: 7 global regions
- Distribution Channels: Online and Offline
- Total Revenue: ~USD 1.37 million
- Total Profit: ~USD 442K
The substantial variation in both volume and pricing across markets indicates opportunities for targeted optimization strategies that account for local market dynamics while maintaining portfolio-level efficiency.
Methodology & Logic
The diagnostic analysis was guided by supporting business questions, structured under the framework: Size, Rank, Explain, Compare, & Recommend.
- What is the total revenue by region, product category, and sales channel?
- Which regions and categories contribute the largest share of total revenue?
- Are high-revenue segments driven by volume, pricing, or margin differences?
- How do offline vs. online channels differ in scale and efficiency?
- Which segments should receive increased investment, and what uplift can be expected?
Analytical Techniques Applied:
- Pareto-style calculations & visuals: Utilized to identify concentration risks and highlight the “vital few” segments driving disproportionate revenue.
- Standardization (0-1 scaling): Used to compare volume, price, and margin drivers directly across categories with different scales.
Diagnostic Analysis
1. Regional Revenue Concentration
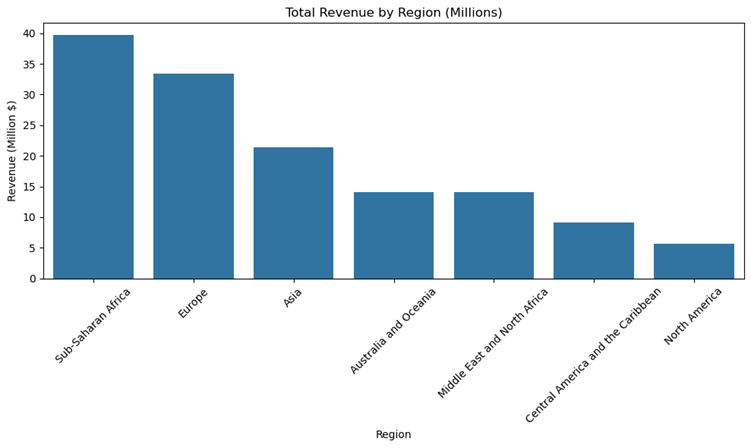
Geographic performance is characterized by high concentration, with the top three regions contributing approximately 69% of total global revenue. A significant concentration risk is present, as the top two regions alone (Sub-Saharan Africa and Europe), account for $73.1M, or 53.2% of total revenue. That exceeds the 50% threshold, indicating a heavy reliance on these two markets.
The revenue contributions of the top three regions are as follows:
- Sub-Saharan Africa: $39.7M (28.9% of total)
- Europe: $33.4M (24.3% of total)
- Asia: $21.3M (15.5% of total)
The portfolio experiences a steep decline in contribution beyond these leaders. The remaining revenue is fragmented across four secondary regions: Australia and Oceania (14.1M), Middle East and North Africa (14.1M), Central America and the Caribbean (9.2M), and North America (5.6M).
2. Product Portfolio Dynamics
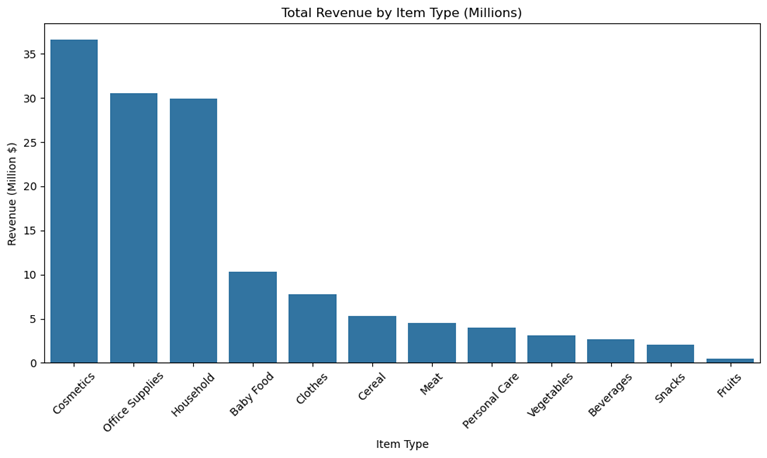
The Product Category analysis reveals a similar pattern of high concentration among top performers. The top three categories (Cosmetics, Office Supplies, and Household goods) drive approximately 70% of total revenue, while the top five categories (including Baby Food and Clothes) account for roughly 84%.
In stark contrast, the lowest-performing category, Fruits, contributes only $0.5M. This disparity highlights a profound performance gap between the core revenue engines and the lower-tier niche categories.
3. Analysis of Revenue Drivers: Volume, Price, and Margin
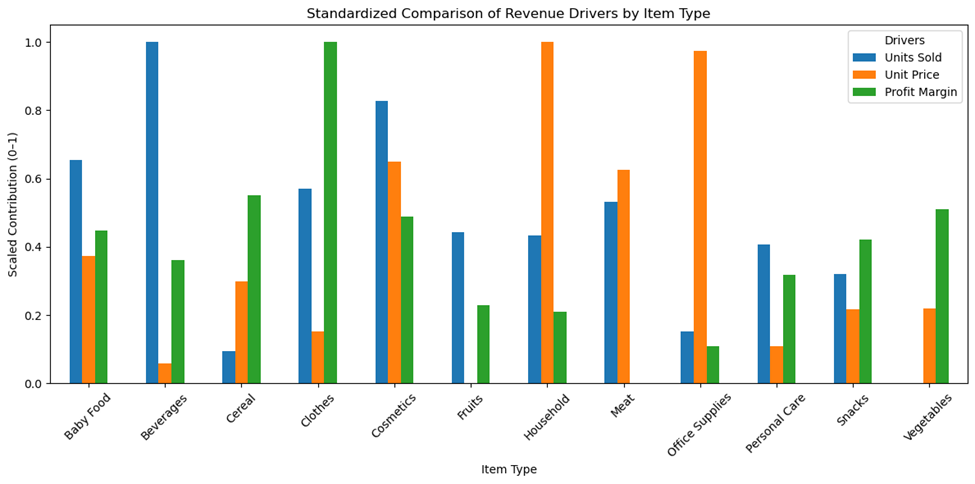
Synthesizing the standardized scaling data reveals the specific drivers behind category performance. High revenue is rarely the result of a single factor, but rather the strategic interplay of volume, price, and operational efficiency.
Overall Winner:
Cosmetics is the most dominant category because it maintains high performance across both primary drivers. It scores highly in unit volume (0.83) while maintaining a strong price point (0.65), creating a balanced and sustainable revenue engine.
Volume-Driven Categories;
Certain categories achieve high revenue despite lower unit sales by leveraging significant pricing power:
- Household: Achieves maximum pricing (1.00), which successfully compensates for moderate unit volume (0.43).
- Office Supplies: Utilizes extreme pricing (0.97) to overcome very low unit volume (0.15).
Volume-Driven Segments:
High unit sales fail to maximize revenue when pricing is insufficient to support the scale:
- Beverages: While scoring a maximum 1.00 in units sold, its rock-bottom pricing (0.06) results in low total revenue
- Clothes: This category possesses the highest profit margin efficiency (1.00) in the entire portfolio. However, despite respectable volume (0.57), its total revenue potential is severely capped by a low pricing score (0.15).
Profitability Gap:
Meat represents a significant “value-drain within the portfolio. While it is a solid revenue contributor ($4.5M) with strong pricing (0.63) and moderate volume (0.53), it sits at the 0.0 baseline for profit margin. The category generates significant top-line activity without contributing to the bottom line, representing a non-contributory segment from a margin perspective.
4. Channel Efficiency: Offline Scale vs. Online Margin
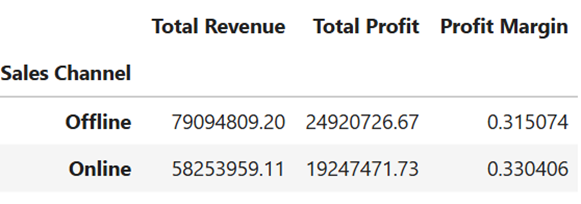
The sales channel analysis reveals a “scale vs. efficiency” paradox. Offline channels currently provide the necessary scale for the business, but online channels demonstrate superior pricing efficiency.
Offline transactions account for 57.6% of total revenue, confirming it as the primary driver of organizational scale. However, the Offline margin of 31.51% (calculated as $24.92M profit / $79.09M revenue) is outperformed by the Online margin of 33.04%. This indicates that Online transactions are more efficient at circumventing the typical volume-price trade-offs identified in the standardized scaling analysis.
Strategic Recommendations for Investment
Based on this diagnosis, the following three segments are recommended for prioritized investment to maximize revenue and protect margins:
- Sub-Saharan Africa (Offline): Largest revenue contributor with strong absolute profit. Investment here secures scale and consolidates leadership in a high-performing region.
- Europe (Online): Strong margin efficiency (36%) combined with solid revenue base. Investment here leverages digital channels to maximize profitability.
- Australia & Oceania (Offline): Smaller in scale but highest profit margin (45%). Investment here diversifies geographic exposure while capturing efficiency gains.
Expected Impact: A targeted 10% increase in investment across these segments is projected to deliver +USD 4.52M in revenue and +USD 1.52M in profit, representing a 3-4% uplift in total performance.
Risk Mitigation
- Avoid Volume Traps: Categories like Beverages and Clothes sell high volumes but weak pricing caps revenue potential.
- Address Profitability Gaps: Segments like Meat generate revenue but contribute nothing to profit margins — resources should be limited here.
- Diversify Beyond Concentration: Current portfolio health is precarious due to reliance on Sub-Saharan Africa, Europe, and three product categories (Cosmetics, Office Supplies, Household). Leadership should actively expand into secondary regions and categories to reduce vulnerability.
Technical Stack
Data Processing & Analysis
- •Python 3.x: Core programming environment
- •Pandas: Data manipulation and aggregation
- •NumPy: Numerical computations and scaling
Visualization & Reporting
- •Seaborn: Statistical data visualization
- •Matplotlib: Chart generation and customization