2025 Hospital-Acquired Conditions Analysis

Fall and Trauma Rate Up to 16X Higher Than Other Measures

  • MySQL
  • SQL
  • Microsoft Excel

At a Glance

Goal: Identify which preventable conditions posed the greatest patient safety risk in 2025.

Process: Cleaned and analyzed CMS HAC data in MySQL, then exported results to Excel for stakeholder-ready visuals.

Key Insight: Falls and Trauma accounted for the overwhelming majority of HAC variation in 2025, with rates up to 16 per 1,000 discharges, far exceeding other measures.

Project Summary

This project analyzed the 2025 CMS Deficit Reduction Act Hospital-Acquired Conditions (HAC) dataset to identify which preventable conditions pose the greatest risk to patient safety and warrant immediate intervention from healthcare leadership. By examining national rates across four high-cost HAC measures in 2025, the analysis aimed to move beyond surface-level reporting and uncover where quality improvement resources would yield the highest return. 


Key Finding: Falls and Trauma occurred at rates up to 16 times higher than other measured conditions, signaling a critical opportunity for targeted prevention strategies.

Business Questions

To ensure that the analysis stayed focused and actionable, the project was guided by the following questions: 

  • What were the average HAC rates by measure in 2025?
  • Which measures showed the highest and lowest HAC rates nationally?
  • Which measures contributed most to variation in patient safety outcomes?
  • Which condition areas should be prioritized to reduce HACs and improve patient safety outcomes?

Scope & Project Steps

This project analyzed CMS HAC data to answer strategic patient safety questions focused on reducing preventable harm. The dataset tracks four preventable, high-cost conditions (foreign object retained after surgery, blood incompatibility, air embolism, and falls/trauma) based on Medicare fee-for-service claims. Reported annually and dependent on accurate Present on Admission (POA) coding, the dataset provides a reliable national view of patient safety outcomes for 2025.


Analytical workflow:

  • Ingested raw CMS HAC provider-level data into MySQL for structured querying
  • Performed data profiling to identify formatting inconsistencies and redundant fields
  • Cleaned and standardized measure labels while removing unnecessary columns
  • Validated data integrity through duplicate detection and null-value assessment
  • Calculated descriptive statistics (mean, standard deviation, coefficient of variation) to compare measure performance
  • Ranked conditions by national prevalence, range, and variability to prioritize intervention areas
  • Synthesized quantitative results into actionable, stakeholder-ready recommendations

Analysis & Calculations

Below are the key steps and calculations that shaped the analysis:

Data Preparation

Raw provider-level data was loaded into MySQL for cleaning and transformation. The staging table preserved the original structure while enabling iterative validation. Unnecessary temporal columns (Start_Quarter, End_Quarter) were removed to streamline the analysis. Measure labels were standardized using pattern-matching updates to ensure consistent grouping.

Statistical Analysis

Three complementary calculations were applied to compare condition performance:

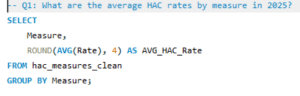
  • Mean rate per 1,000 discharges to establish baseline frequency


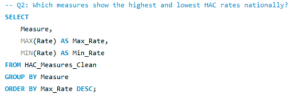
  • Range analysis (min/max) to identify performance extremes across facilities


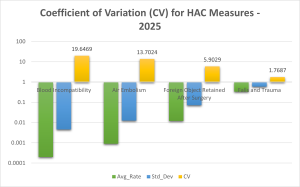
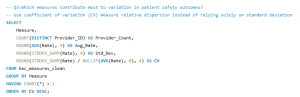
  • Coefficient of variation (CV) to assess relative dispersion while accounting for differences in scale

Findings

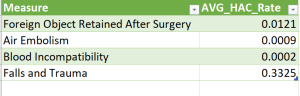
1. Falls and Trauma Averaged 0.333 Cases per 1,000 Discharges

Falls and Trauma was most significant driver of hospital-acquired conditions in 2025 nationally, compared to near-zero rates for other measures. This makes them a top priority for patient safety improvement. 


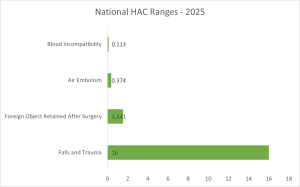
2. Falls and Trauma Rates Range from 0 to 16 Nationally

Hospitals reported Falls and Trauma rates as high as 16 per 1,000 discharges, while other measures peaked below 2. This extreme variation highlights uneven performance and the opportunity to target facilities with the highest rates.


3. Falls and Trauma Showed the Highest Meaningful Variation (Std Dev = 0.581)

Air Embolism and Blood Incompatibility showed inflated coefficients of variation due to near‑zero averages. However, Falls and Trauma had a high mean rate as well as the largest standard deviation (about 0.581). This makes them the most impactful source of patient safety variation.


Conclusion & Recommendations

To maximize impact on patient safety and financial performance, a tiered approach grounded in both prevalence and variability is key:

  1. Scale Falls and Trauma prevention programs at facilities with elevated rates: Given its outsized contribution to HAC variation, this area offers the clearest path to reducing penalties and improving quality scores.
  2. Maintain rigorous surgical safety protocols to prevent retained foreign objects: While infrequent, these events carry disproportionate clinical and reputational risk, making protocol consistency essential.
  3. Sustain lightweight monitoring for Air Embolism and Blood Incompatibility: Continued surveillance ensures compliance and early detection while avoiding resource diversion from higher-impact priorities.
Scroll to Top