
In earlier stages of this project, I defined StaffWise’s revenue leakage problem and outlined key metrics for analysis. The previous update provided a detailed breakdown of the dataset and initial patterns. This report is a culmination of those efforts. It provides a summary of key findings, highlights key patterns and offers actionable insights that can help StaffWise recover lost revenue and optimize for sustainable growth.
Key Facts
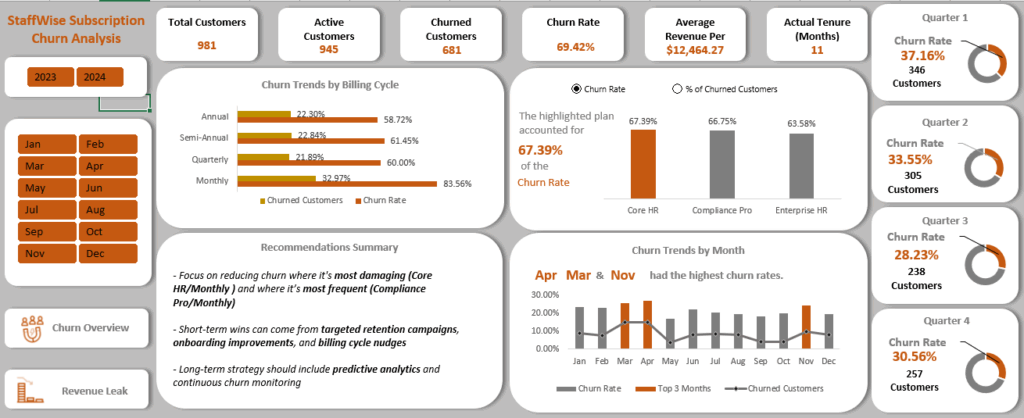
A review of StaffWise’s subscription data reveals several critical performance metrics and revenue indicators that shed light on the company’s current challenges:
Customer Overview
- Total Customers: 981
- Active Customers: 945
- Churned Customers: 681
- Churn Rate: 69.42%
- Average Tenure: 11 months
- Average Revenue per User (ARPU): $12,464.27
Insight: While customer acquisition appears strong, the churn rate of nearly 70% suggests that the majority of customers exit before delivering long-term value.
Revenue Overview
- Expected Revenue: $13,770,441
- Actual Revenue: $11,778,734
- Revenue Gap: $1,991,707
Insight: The business is losing nearly $2 million in revenue compared to projections, largely due to operational (payment issues) and behavioral issues (churn) across the customer base.
Revenue Loss Breakdown
- Failed Payments: $1,050,858
- Refunds: $353,400
- Free Trials (Zero Revenue): $587,449
Combined Loss from failed transactions, refunds, and non-converting trials accounts for over 14% of total expected revenue.
Dashboard Visuals

Task 1: What are the Patterns and Plan-Level Differences in Customer Churn?
1.1: Churn by Subscription Plan
| Subscription Plan | Churn Rate | Churned Customers | % of Churned Customers |
| Compliance Pro | 66.75% | 265 | 36.40% |
| Core HR | 67.39% | 250 | 34.34% |
| Enterprise HR | 63.58% | 213 | 29.26% |
Insight 1: Core HR Plan has the highest churn rate, meaning customers are leaving at the fastest pace.
Recommendations:
- Review product usage or customer feedback for Core HR to identify pain pointsa
- Conduct short exit surveys or interviews for Core HR cancellations
- Consider A/B testing feature improvements or pricing adjustments
Insight 2: Compliance Pro Plan has the highest churn volume (265 customers)
Recommendations:
- Analyze this segment’s customer lifecycle – when do they typically churn? Is it after onboarding? Maybe after key compliance deadlines? Or a specific month?
- Offer retention campaigns: loyalty perks, renewal discounts, or personalized support for at-risk accounts
- Explore whether customer expectations for Compliance Pro are mismatched with what’s delivered
Insight 3: High churn rates across all plans suggest a systemic issue, possibly in onboarding or early value delivery
Recommendations:
- Audit the first 30-60 days of the customer journey
- Improve onboarding documentation, tutorials, or welcome emails. Tailor the documentation to hospitality roles.
- Introduce in-app nudges to guide users to key wins like staff scheduling or payroll setup
1.2: Churn by Billing Cycle
| Billing Cycle | Churn Rate | Churned Customers | % of Churned Customers |
| Annual | 58.72% | 165 | 22.30% |
| Monthly | 83.56% | 244 | 32.97% |
| Quarterly | 60.00% | 162 | 21.89% |
| Semi-Annual | 61.45% | 169 | 22.84% |
Insight 1: The Monthly Billing Cycle has the highest churn rate (83.56%) and the highest volume of churned customers (244)
Many smaller hospitality businesses prefer monthly plans for flexibility, but often churn due to inconsistent staffing needs, budget constraints, or incomplete onboarding.
Recommendations:
- Offer financial incentives for switching to longer billing cycles, like Annual (where churn rate and volume are lowest)
- Introduce “commitment nudges” during checkout or onboarding that emphasize the benefits of longer billing cycles (e.g., better retention tools, priority support)
- Proactively reach out to monthly customers with tips, value reports, and success stories
Insight 2: Quarterly and Semi-Annual cycles have moderate churn rates (~60%), but still contribute to nearly half (44.73%) of all churn volume
These plans are common among mid-sized hospitality operators who may upgrade during peak seasons and cancel/downgrade when demand dips
Recommendations:
- Offer renewal bonuses, loyalty points, or renewal discounts to Quarterly and Semi-Annual customers
- Send mid-cycle engagement emails showing usage stats, or tips to boost satisfaction and reduce churn risk
- Use mid-term surveys to learn why they might consider canceling, and adjust messaging or features accordingly
Insight 3: Annual subscribers are more committed and stable, suggesting that long-term billing correlates with higher retention
Recommendations:
- Highlight annual plans in sign-up flows, pricing pages, and email campaigns with strong value messaging
- Create easy ways for existing shorter-cycle users to upgrade to annual (with prorated pricing or one-click upgrades)
- Mid-cycle engagement, renewal incentives, and proactive support are key tactics to lower churn across all cycles
1.3: Churn by Subscription Plan + Billing Cycle
Top 3 Highest Churn Rates by Subscription Plan + Billing Cycle
| Subscription Table | Billing Cycle | Churn Rate | Churned Customers | % of Churned Customers |
| Core HR | Monthly | 84.78% | 78 | 10.40% |
| Enterprise HR | Monthly | 82.14% | 69 | 9.20% |
| Compliance Pro | Monthly | 82.11% | 101 | 13.47% |
Top 3 Highest Churn Volumes by Subscription Plan + Billing Cycle
| Subscription Table | Billing Cycle | Churn Rate | Churned Customers | % of Churned Customers |
| Compliance Pro | Monthly | 82.11% | 101 | 13.47% |
| Core HR | Monthly | 84.78% | 78 | 10.40% |
| Enterprise HR | Monthly | 82.14% | 69 | 9.20% |
Insight 1: The highest churn combinations occur under the Monthly billing cycle across all subscription plans
Short-term commitments often attract cost-sensitive, smaller hospitality clients with inconsistent staffing needs, but they also churn faster, likely due to limited onboarding, quick trials, or seasonal use.
Recommendations:
- Offer flexible “seasonal use” plans or discounted quarterly/annual options tailored to hospitality cycles (e.g., peak vs. off-season)
- Build quick-start onboarding guides for hotels/restaurants that need to hire fast (e.g., preloaded templates for job roles, shift planning)
- Add in-app nudges showing how long-term users reduce turnover or save admin time — frame longer cycles as smarter staffing ROI
Insight 2: Core HR/Monthly customers are leaving at the fastest rates
Core HR is your entry-level plan, likely used by small restaurants, boutique hotels, or franchises. These users churn fastest, probably due to limited internal HR expertise or unclear value from the tool.
Recommendations:
- Run onboarding webinars or offer “HR-in-a-box” toolkits with pre-made templates for hospitality hiring, payroll tracking, and scheduling.
- Bundle Core HR with job board integration, WhatsApp/SMS alerts, or mobile-first tools that resonate with lean hospitality teams
- Target users nearing 60 days with “upgrade-and-save” prompts tied to real usage data (e.g., “Save 2 hours/week with Compliance Pro”)
Insight 3: Compliance Pro/Monthly has the highest churn volume
Compliance Pro serves larger hospitality operators, managing certifications, labor laws, and multi-site staffing. High volume churn suggests that these users struggle to sustain value month-to-month, or fail to implement the tool deeply.
Recommendations:
- Offer dedicated onboarding support for properties with 50+ staff, including compliance audits or checklist integrations.
- Proactively flag accounts with poor compliance usage (e.g., low training completions) and assign success managers or reminders.
- Showcase risk reduction in renewals e.g., “Avoided $X in labor violations” or “X% improvement in training compliance”
- Map the journey of these customers, looking for in engagement or drop-off points
- Explore mismatches between expectations vs. delivered value, particularly for compliance-related needs
- Run targeted retention campaigns such as customer success check-ins
1.4: Churn by Quarter
| Quarter | Churn Rate | Churned Customers |
| Qtr 1 | 37.16% | 346 |
| Qtr 2 | 33.55% | 305 |
| Qtr 3 | 28.23% | 238 |
| Qtr 4 | 30.56% | 257 |
Insight 1: Q1 has the highest churn rate and the highest churn volume
This likely coincides with post-holiday staff reductions, budget resets, and the end of peak hiring season (Nov-Dec) in hospitality.
Recommendations:
- Launch workforce planning tools in December to help hotels forecast Q1 needs and keep the software relevant
- Offer pause-and-resume billing options for seasonal clients instead of full cancellation
- Push early renewal campaigns in late Q4, showing year-over-year hiring outcomes and ROI specific to the holiday season
Insight 2: Q3 appears to be a stable retention period
This trend is possibly because the period aligns with peak travel season in many regions (July – September), when hotels are hiring and onboarding seasonal staff.
Recommendations:
- Highlight how your software streamlines seasonal onboarding, scheduling, and compliance. Build case studies around this.
- Introduce Q3-exclusive upsells like SMS-based scheduling, multilingual onboarding tools, or compliance reminders
- Use this quarter to gather NPS (Net Promote Score) data and identify which features are driving satisfaction in high-usage periods
Insight 3: Churn trends improve after Q1, but creep up again in Q4
This suggests some late-year churn pressure, possibly due to end-of-year budget exhaustion, high turnover post-peak season, or decision-makers offboarding as properties downsize.
Recommendations:
- Offer retention-focused features like offboarding templates or exit interview tracking during Q4
- Send automated reports showing staffing efficiency and turnover insights that help justify renewals
- Target HR managers with year-end wrap-ups e.g., “Here’s how many hours you saved this year” to reinforce product value ahead of renewal decisions
Task 2: When do customers churn, and how much revenue is lost?
2.1: Churn by Tenure
| Tenure | Churned Customers |
| 0-3 Months | 0 |
| 4-6 Months | 2 |
| 7-9 Months | 13 |
| 10-12 Months | 51 |
| 13-15 Months | 174 |
| 16-18 Months | 157 |
| 19-21 Months | 118 |
| 22-24 Months | 55 |
| 25+ Months | 111 |
Insight: 65.93% of the customers who churned did so after 13-21 months
Recommendations:
- Trigger personalized outreach between months 12-21 to identify and address disengagement early
- Analyze usage patterns during months 10-13, and look for drop-offs in activity or support requests to refine onboarding and mid-term engagement strategies
2.2: Revenue Lost When Customers Churn
| Tenure | ChurnRevenueLoss |
| 0-3 Months | $0.00 |
| 4-6 Months | $696.00 |
| 7-9 Months | $11,454.00 |
| 10-12 Months | $39,529.00 |
| 13-15 Months | $158,002.00 |
| 16-18 Months | $302,361.00 |
| 19-21 Months | $438,605.00 |
| 22-24 Months | $293,630.00 |
| 25+ Months | $685,749.00 |
Insight: Over 70% of churn revenue loss comes from long-term customers (16+ months)
Recommendations:
- Begin targeted retention campaigns before customers hit the 13-month point to reduce churn risk
- Offer value-add features or other incentives to retain high-tenure customers (16+ months) who drive most of the revenue
- Monitor early signs of dissatisfaction in long-tenure accounts
Task 3: How much revenue is lost due to failed or refunded payments?
| Type of Loss | Amount | % of Total Revenue Gap | % of Expected Revenue |
| Failed Payments | $ 1,050,858 | 52.76% | 7.63% |
| Refunds | $ 353,400 | 17.74% | 2.57% |
| Free Trial | $ 587,449 | 29.49% | 4.27% |
Insight: Payment issues alone account for 70.51% of the revenue gap and 10.20% of the expected revenue
Recommendations:
- Improve payment reliability by implementing automated payment retries and timely reminders to reduce failed transactions
- Review refund policies and workflows to identify avoidable refund scenarios and improve customer satisfaction without revenue loss
- Monitor and flag high-risk accounts with recurring payment issues to enable proactive outreach and intervention before churn occurs
Conclusion
This analysis confirms that StaffWise’s revenue stagnation is not due to weak demand, but to critical inefficiencies in customer retention and payment execution. While acquisition remains strong, nearly 70% of customers churn, and over $1.9 million in expected revenue is lost through failed payments, refunds, and free trials that never convert.
Three patterns stand out:
- Short-cycle plans (especially Monthly) attract high volumes but churn quickly, eroding long-term value
- Core HR and Compliance Pro customers are leaving at unsustainable rates, often before realizing full product value
- Revenue loss is most severe among long-tenure customers, signaling that churn is not just a front-end problem – it hits mature, high-value accounts too
On the payment side, more than half the revenue gap stems from failed transactions, suggesting a need to strengthen billing operations and customer engagement around renewal points.
These findings signal that StaffWise is at a pivotal moment where improving retention and payment reliability can unlock profitable growth without needing to scale acquisition further.
The path forward includes:
- Doubling down on onboarding, education, and value delivery in the first 90 days
- Proactively engaging mid- and long-tenure customers before the churn cliff
- Strengthening billing systems and offering more flexible, seasonally aligned plans
- Running targeted campaigns based on customer plan, tenure, and risk indicators
With these insights and the dashboards built for ongoing monitoring, StaffWise is equipped to plug revenue leaks and position itself for long-term resilience and growth.